From Prediction Error to Batch Loss
Compare a prediction with its target, then combine errors across samples and batches.
Prediction error
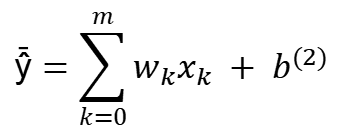
The error is the difference between the prediction and the observed target. The deck uses absolute values to add error magnitudes. The interactive training demo uses mean squared error.



The slide combines the prediction and loss in the following expression.

Samples and batches
Suppose the data is split into N batches, each sample has n features, and the network has m neurons. The slide shows how the loss expressions are grouped across samples and batches.
Sample and sample collection


One batch and N batches
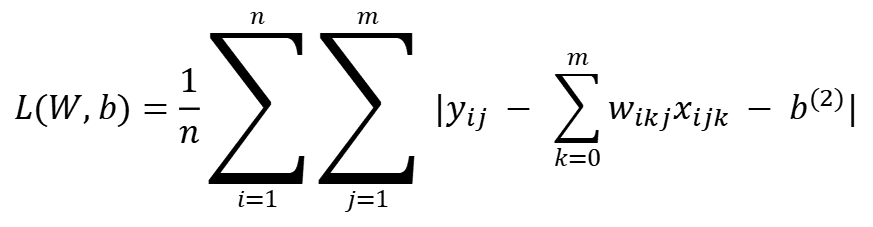
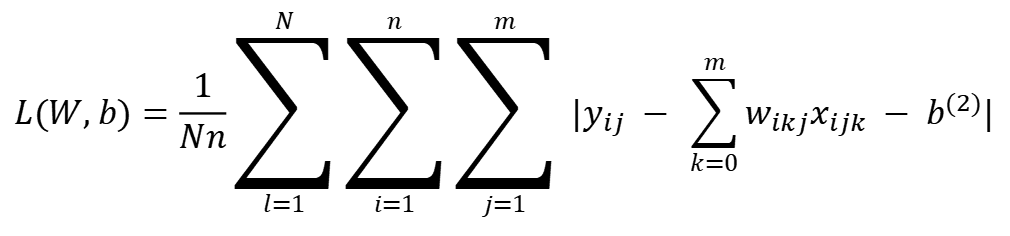
Reading summation notation
Read each summation as a loop over its index. With nested sums, complete the inner sum for each value of the outer index.

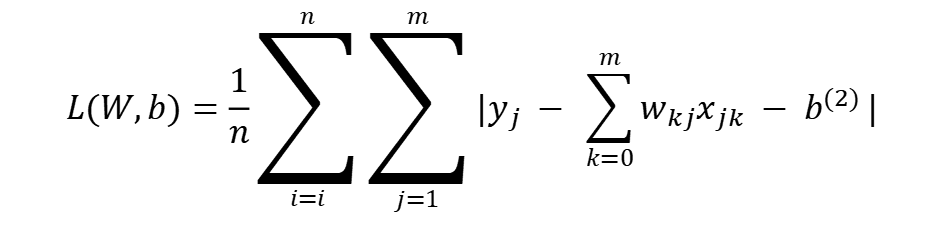
total = 0
for i in range(n + 1):
    total += x[i]
The loop illustrates the first displayed sum, whose upper limit includes n.
Source: Neural Networks Bike Demand, v3. Equation images and diagrams are reproduced from the PowerPoint.